Below are three interactive charts:
- New Listings: the number of new residential listings on the market each month
- Days on Market: the median number of days residential listings are “active”
- Percent of List Price: the median percentage of list price to sold price
New Listings:
Days on Market:
Percent of List Price:
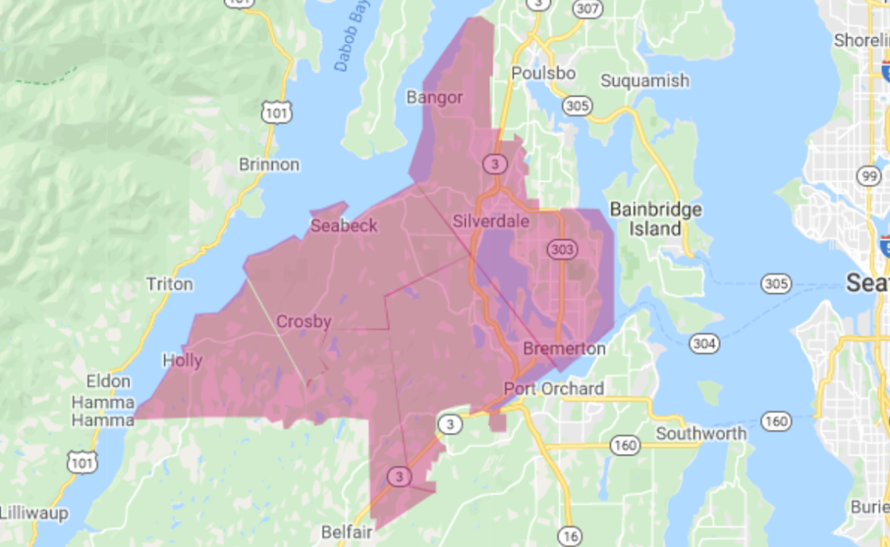
Central Kitsap
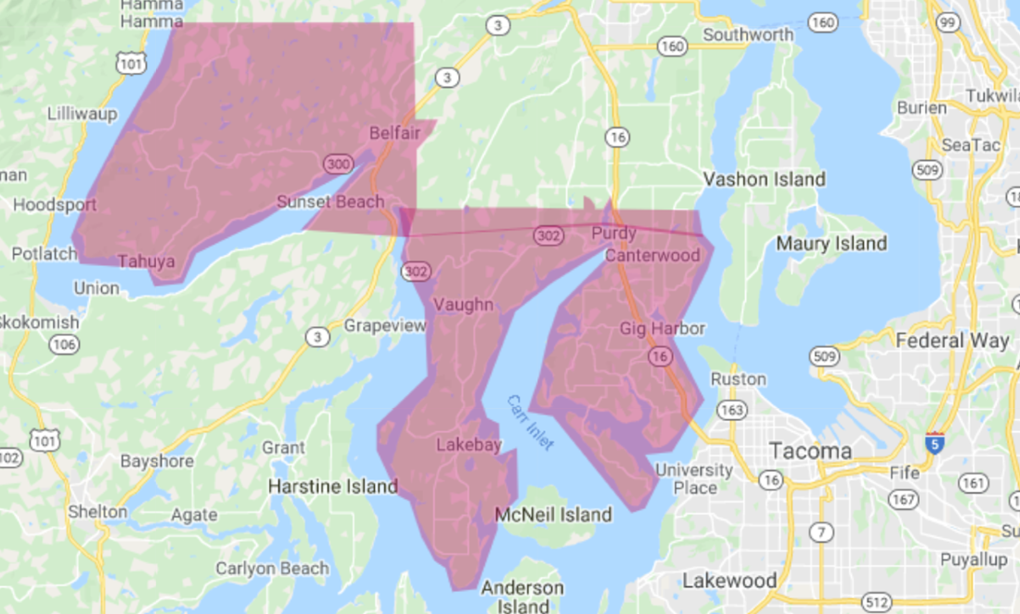
Greater Kitsap
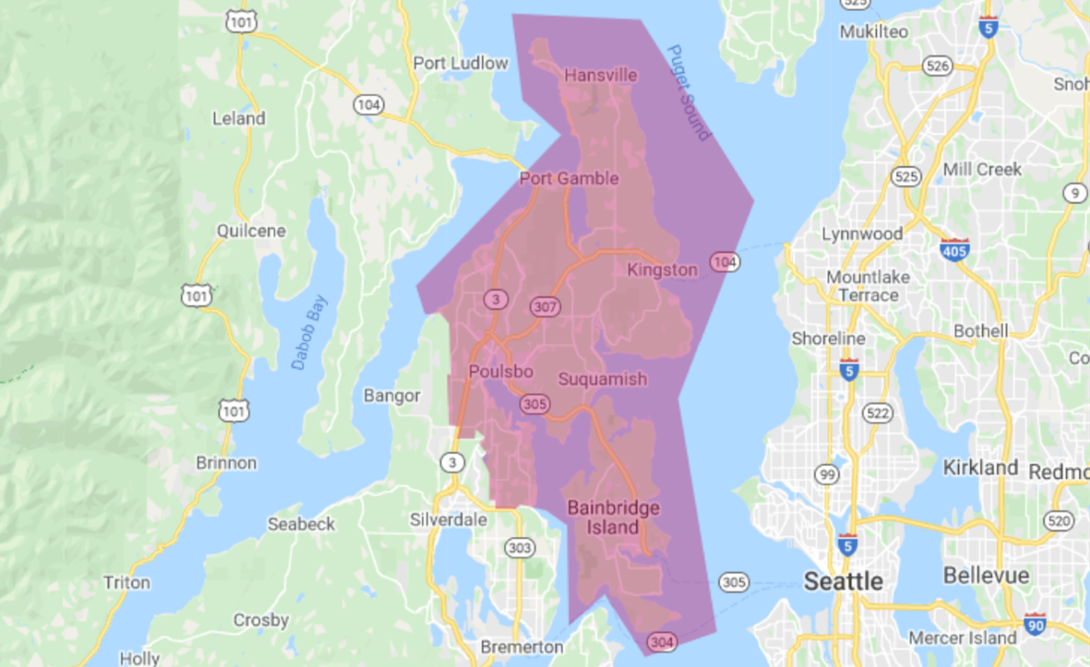
North Kitsap
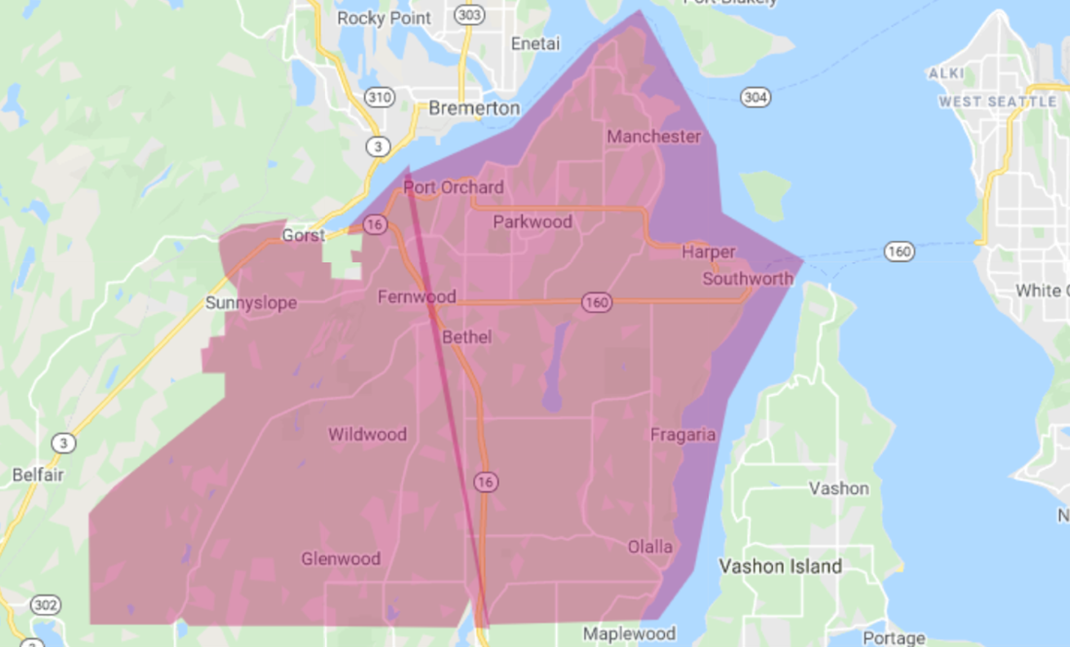
South Kitsap
Have fun! Let us know if you have any questions about today’s market!